Physical Address
304 North Cardinal St.
Dorchester Center, MA 02124
Physical Address
304 North Cardinal St.
Dorchester Center, MA 02124
As of early April 2026 global games industry continues its steady climb with mobile still commanding lion’s share of revenue through in-app purchases (IAPs) while PC and console deliver strong premium sales and live-service income. Exact “trailing 12 months” (April 1, 2025 – March 31, 2026) data isn’t fully aggregated yet in public reports but we have crystal-clear 2025 full-year figures from AppMagic and Sensor Tower plus January–March 2026 monthly snapshots. These show same powerhouse titles dominating with only minor ranking shifts driven by seasonal events.
Mobile IAP revenue hit approximately $81.8 billion globally in 2025 (a modest +1.3% YoY), while overall games market reached roughly $188.8–197 billion. Live-service mechanics, gacha, battle passes and holiday events remain biggest revenue engines.
Here’s your complete data-driven breakdown.
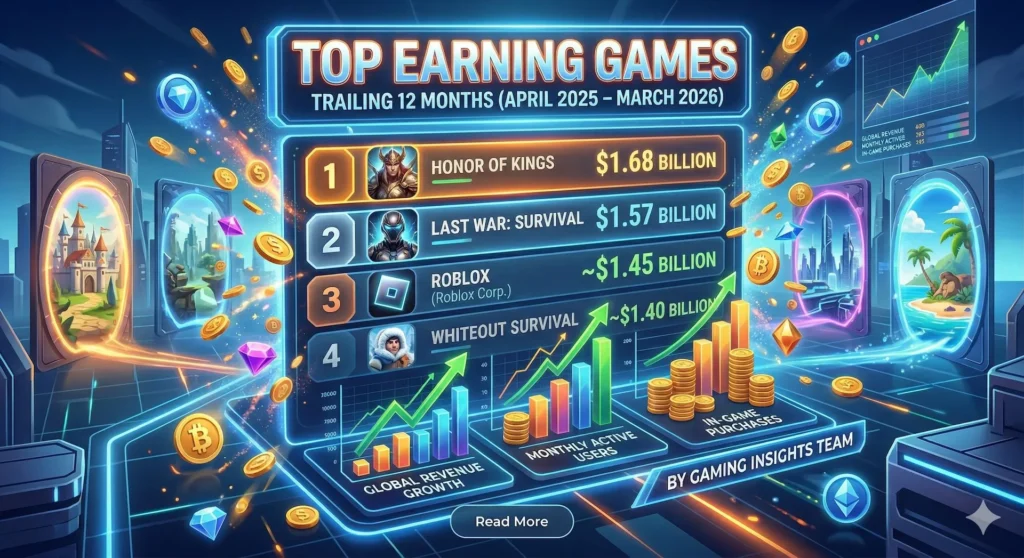
Mobile accounted for over 50% of total industry revenue again in 2025. Eight titles crossed the $1 billion mark in IAP revenue alone — a new record. Chinese publishers (especially Tencent) and Western live-service hits (Scopely, Dream Games, FunFly) owned the leaderboard.
| Rank | Game | Publisher | Revenue (2025) | Key Notes |
|---|---|---|---|---|
| 1 | Honor of Kings | Tencent | $1.68 billion | #1 for the 4th straight year; ~99% from China |
| 2 | Last War: Survival | FunFly / FirstFun | $1.57 billion | Explosive +42% YoY growth; huge in US, Japan, Korea |
| 3 | Roblox | Roblox Corp. | ~$1.45 billion | UGC platform strength across platforms |
| 4 | Whiteout Survival | Century Games | ~$1.40 billion | Survival-strategy king |
| 5 | Royal Match | Dream Games | $1.37 billion | Puzzle leader (slight dip from 2024) |
| 6 | Monopoly Go! | Scopely | $1.36 billion | US-heavy; includes webshop revenue |
| 7 | PUBG Mobile | Tencent / Krafton | $1.12 billion | Steady battle royale performer |
| 8 | Candy Crush Saga | King | ~$1.01 billion | Evergreen puzzle cash cow |
Next tier highlights (selected): Gossip Harbor (~$550M), Pokémon Go (~$494M), Clash Royale (~$453M), Kingshot (~$449M), Honkai: Star Rail (~$423M).
Early 2026 Momentum (Jan–Feb snapshots)
The pattern is clear: seasonal live-ops (holidays, collaborations, limited-time cosmetics) create massive revenue spikes month-to-month.
Global PC/console title-by-title revenue is trickier to track because many earnings come from ongoing cosmetics, DLC and microtransactions rather than upfront full-game sales. However Circana’s US full-year 2025 data (retail + digital full-game sales from participating publishers) provides the clearest Western-market proxy. Overall U.S. consumer spending on video games reached $60.7 billion in 2025 (+1.4% YoY), the second-highest on record.
Important note on revenues: Circana ranks games by tracked full-game dollar sales (physical + digital) but does not publicly disclose exact per-title revenue figures to protect individual publisher data. The rankings below reflect dollar-sales performance only. We’ve included all available launch metrics, unit sales (where disclosed by publishers) and contextual insights from Circana reports and earnings calls.
Other strong 2025 US performers (per Circana): Madden NFL 26, EA Sports College Football 26, and evergreen live-service titles like Fortnite, Minecraft and GTA Online continued generating billions through ongoing content. Live service stalwarts (Fortnite, Roblox, GTA V/Online) print money year-round via cosmetics and battle passes.
The data proves one thing: consistency + live operations beats one-off hits. Games that keep players engaged for months (or years) through fresh content are printing money. For players this means more free-to-play experiences with deeper progression systems but also more temptation to spend on cosmetics and battle passes.
Expect Q2–Q4 2026 reports to show even tighter competition as new titles try to crack top 10 and established giants double down on events.
Sources: AppMagic, Sensor Tower, Business of Apps, Circana (full-year 2025 + monthly reports), Newzoo, GamesIndustry.biz, IGN, publisher earnings (EA, Take-Two, Capcom, etc.) (full-year 2025 + early 2026 data). Figures are consumer spending / IAP estimates and may exclude certain Android stores or ad revenue. Circana full-game dollar sales rankings exclude DLC/MTX and non-participating digital sales.
What do you think — is your favorite game on the list? If you enjoyed this breakdown share it with your fellow gamers! 🚀